Column headers |
Previous section: Data columns and property columns
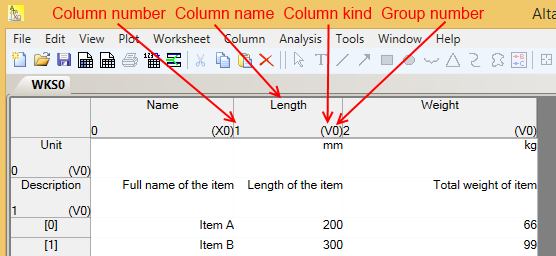
In the following figure we take a more detailed look at the column header of the second column.
On the left side of each column header, there is a number designating the column number. Please note that this number is ‘1’, despite of the fact that this is the column header of the 2nd column. This is because in Altaxo (and in C# as the underlying programming language) indexing always starts with 0 (zero), thus the first column gets the index 0, the second column gets the index 1, and so on. The same indexing is used for the row numbering.
In the top center of the column header you can find the column name. The column name must not be empty. It can contain any characters, including leading or trailing white spaces. I decided not to make any artificial restrictions here. Of course, you have to be careful with leading or trailing white spaces, since you will not see them in the column header. Tip: when you try to rename that column, you will see them by the space they take in the renaming text box.
In the lower right corner of the column header, you will find a string consisting of one or more characters and a number. The characters designate the column kind. In the example here, the column kind is ‘V’, which means ‘Value’. Possible column kinds are:
X (first independent variable)
Y (second independent variable)
V (value, i.e. dependent variable)
Label (Label, designates that this column contains labels for the column to the left)
Err (Error, designates that this column contains plus-minus-deviations of the column to the left)
pErr (Plus Error, designates that this column contains deviations in positive direction of the column to the left)
mErr (Minus Error, designates that this column contains deviations in negative direction of the column to the left)
The column kind is used only when you select one or more columns and choose to plot them. For instance, when you have selected a ‘V’ column and plot them, Altaxo searches for an X-column (of the same column group) and plots the data of the selected column versus the data of the X-column.
This brings us to column groups: columns can be grouped together. Columns with the same group number belong together. For each column group you can have only one ‘X’-column and one ‘Y’ column. When you sort data by the contents of a column, only those columns that have the same group number as the column that is sorted for are affected.
I’m not very happy with the concept of column groups, but they are really handy. On the other hand, it breaks the concept of a (single) data table. In fact, you should consider each column group as a data table in its own, and use multiple column groups rarely.
Next section: Creating a new worksheet
