Modifying a graph |
The graph's size is the size of the root layer of the graph when printed at a scale of 100%. Although it is possible to use an arbitrary size and later scale the graph according to the desired print size, I strongly encourage to design the graph with the desired size from the beginning. Why this is so?
Let's say you want to publish a paper in a journal. The journal has a text column width of 6 cm and a font size of 10 pt. Then the natural way to create a graph for that paper is to set the with of the root layer to 6 cm (the height of the graph is still your choice), and to set the default font size of the graph to 10 pt. Then, assuming the graph is published in that paper in its original size, the text in the graph will appear with a size of exactly 10 pt to ensure maximum readability and a smooth blending with the paper text. Of course, another way would be to create the graph with a root layer size of 12 cm and to set the default font size to 20 pt. Later on, you then scale the graph down to 50% to get the desired with of 6 cm and font size of 10 pt, but this requires some extra steps and calculations.
To modify the graph size, click on the root layer button, select the tab named Position, and enter the desired size. The text boxes where you can enter the size are unit aware. That means, by entering 6 cm you set the size to 6 cm, even if the size was displayed in units of pt (Point = 1/72 Inch) before.
If you have changed the graph size, you probably want to change the default font size, too.
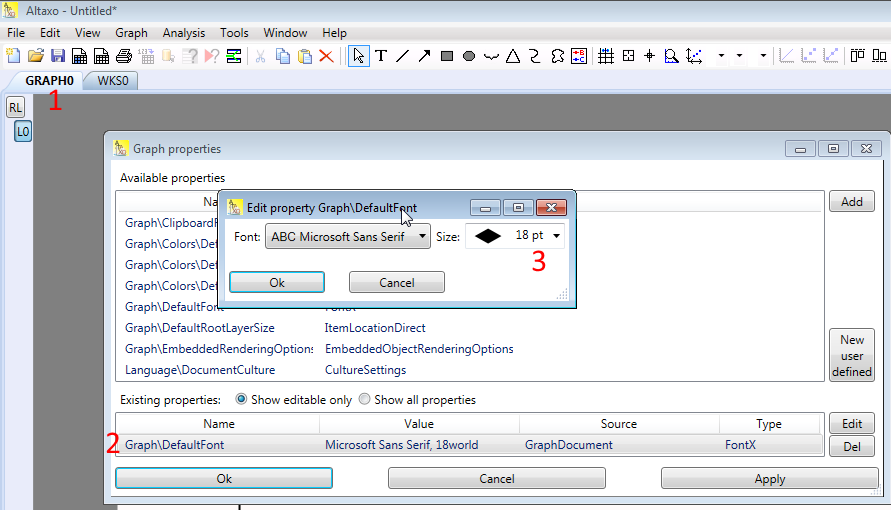
The default font size of the graph is a property that is stored in the property bag of the graph. I will later on explain what a property bag is and how properties are stored in it. For now, it will be sufficient to know that a property has a name and a value, and that multiple properties are stored in a kind of dictionary for every graph. To edit the default font size, you have to change that dictionary entry. Right-click on the document tab of the graph (marker 1 in the figure below) to open the context menu of the graph, then choose Edit graph properties from that context menu. A dialog box opens, with a window showing available properties in the upper part and existing properties in the lower part. Double click onto Graph\DefaultFont in the lower part with the existing properties (marker 2 in the figure below). Another dialog box opens, which allows you to choose a default font and the default font size. Enter the font size of your choice (marker 3 in the figure below) and close this dialog box, then close the property dialog box, too. Now that you have changed the default font size, new text in the graph will be created with the new default font size. The font size of the text that already exists is not changed when changing the default font size.
To every graph belongs notes text. You can view and edit the notes text. To do this, make the graph the current document. Then make sure, that the Notes tool window is shown. If it is not shown, make it visible by choosing View→Notes from the main menu or pressing CTRL+ALT+N at the keyboard. You can then visit, add or edit the text in the notes window.
Next section: 3D-Graphs
